What to expect in a stock market recovery
There is an adage in sports, “Pressure is something you feel when you are not prepared.” While preparation does not eliminate all pressure, the sentiment holds truth. It is why coaches run drills and push players in practice. They do not want the pressures of competition to overwhelm players in the moment they need to perform their best. Financial planning is about preparation too.
In our March post, Decision making in the face of uncertainty, we pointed out when the market goes down, “…the only sellers who would be happy were the few who sold before the market bottomed, and IF they bought again at a price lower than the time of sale, and IF they didn’t get scared out of the stock market in the future.”
It is that last IF we want to prepare you for. If the market is recovering, why would people get scared out of it?
When a recovery starts, there is no bell which rings, or announcement made that the market has hit bottom. To the contrary, the markets just rise even though the news at and after the bottom is predominantly negative.
Well, one of the culprits is that market recoveries feel a lot like declines, since there is a lot of negativity in the news. When a market recovery starts, there is no bell which rings, or announcement made that the market has hit bottom. To the contrary, the markets just rise even though the news at and after the bottom is predominantly negative.
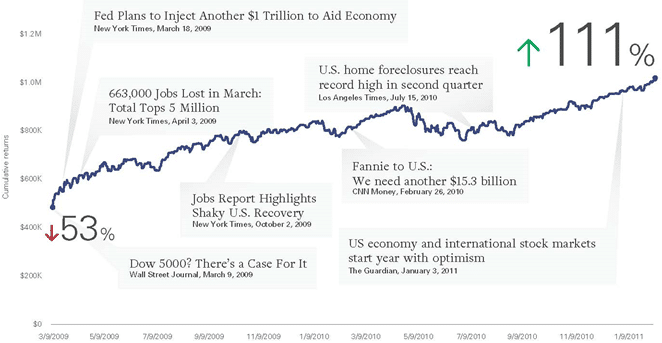
Vanguard produced an illuminating chart which we share below. It is not the easiest to read but the chart concurs with what we talked about in Why and how markets recover. As the headlines in the chart suggest, it was anything but easy to stay invested in 2009 and receive the full benefit of the recovery. We had our research team look a little closer.
Hypothetical $1 million investment in Standard & Poor’s 500 Index at pre-crisis peak, from market bottom in 2009 to breakeven in 2011. Source: Vanguard. Note: See below for a list of complete citations to the articles cited.
When the first headline in the chart ran on March 18, 2009, “Fed plans to Inject another $1 Trillion to Aid Economy,” the market had already risen more than 17% since the low on March 9 for no apparent reason. This Fed intervention was not viewed as good news and the S&P fell 3% over the two days following the announcement. See that tiny little drop a few days after the aid package announcement but before the next highlighted headline about the job losses? It looks tiny but was not. In 2020 terms, it is the equivalent of a 1,000+ point fall in the Dow Jones Industrial Average in just two days.
Move onto the next headline on October 2, 2009, “Jobs Report Highlights Shaky U.S. Recovery.” At that point, the market was up about 52% from its low point. The news however was not good. The article points out this was the 21st month of consecutive job losses, the longest streak in 70 years and the unemployment rate was up to 9.8%. That dip you see was another attention-grabbing drop of nearly 6% in a few days.
The first seven months of the stock market recovery was very strong, but the economy was not, hence the word shaky in the headline. Other popular words to describe the market’s recovery were: “false,” “feeble,” “fragile,” “tenuous,” and “doomed.” These negative headlines appeared virtually every day – any one of them capable of worrying someone out of the market. The economy was awful.
Of course, sometimes the markets would drop without any obvious bad news. The chart highlights no headline but in three weeks starting in the middle of January 2010, the index dropped over 8%. At this point, less than a year from the market bottom, plenty of pundits were saying we still had not seen the worst and the impressive rally was an illusion. The government had been “printing money,” the deficit and debt were at record highs, inflation was coming, and interest rates HAD to rise, causing losses to bonds.

As the headline, “U.S. home foreclosures reach record high in second quarter” suggests, many of the concerns came to fruition. For instance, the chart does not highlight a headline about it but in late April 2010, the index dropped 16% in just 10 weeks, roughly a 4,000 point drop in the Dow today. The apparent culprit was the high debt levels of several European countries and a bailout of Greece.
Concern, negativity, and frightening headlines is normal during a decline but … it is also normal during a market recovery…
The entire time period illustrated was full of negative messages about the economy and the direction of markets. Concern, negativity, and frightening headlines is normal during a decline but what needs to be realized is it is also normal during a recovery and even during an advance.
This chart ends in early 2011. The next nine years were good for stocks, but those years were not uneventful. The market’s advance had several significant drops in the ensuing years, some accompanied by dire headlines. In 2011, those debt concerns resulted in the credit rating of the U.S. being downgraded for the first time, sending stocks down nearly 20%. The market dropped by at least 5% in nine of the ten calendar years from 2010-2019 and by at least 10% in six of those years (source: Dimensional). The headlines around each of these drops, all decidedly negative and even frightening, included nuclear accidents, tsunamis, tensions with North Korea and “trade wars.”
This Coronacrash presents the latest example of why one should not make investment decisions based on headlines or news. Since the low point on March 23, when the chances of panic selling were high, there has been very little positive economic news. The rate of job losses has been unprecedented and as of the time of this writing, the U.S. has an unemployment rate not seen since the Great Depression. Yet the S&P 500 index, while down substantively for 2020, has risen over 30% from its March 23 low.
While that quick spike is consistent with other recoveries, the roads to full recoveries have been bumpy. You should expect this one to be as well.
While that quick spike is consistent with other recoveries, the roads to full recoveries have been bumpy. You should expect this one to be as well. It is not hard to imagine a scenario where the market reacts badly to bad news. Nor is it difficult to create some possible headlines like, “The curve is no longer flat. Covid infections spike” or “Promising vaccine fails trials.” The size or timing of the next drop may be surprising, but the existence of that next big drop should not be. Significant drops and scary headlines are the norm, not the oddity.
Is March 23 the bottom? No one knows but true investors do not need to speculate about the answer. They simply need to remember Why and how markets recover, focus on what they can control (including their intake of news), and stay diversified, disciplined, and patient. Resilience has proven to be more effective than nimbleness in the past and we see no reason it will not win out this time too. We hope this preparation helps when the pressure is on.
It is understandable to have concerns about market volatility and its effect on your portfolio. The situation in the markets is certainly different this time. However, so far it follows a pattern we have seen many times before and have successfully navigated over the years. Bottom line: The “right time” to invest is usually now, whatever the markets’ performance or news headlines might be. By all means, if you have questions or concerns about the plan we created to help you reach your financial goals, please contact us.
Past performance is no guarantee of future returns. The performance of an index is not an exact representation of any particular investment, as you cannot invest directly in an index.
References
Andrews, Edmund L., 2009. Fed Plans to Inject Another $1 Trillion to Aid the Economy. The New York Times (March 18). Accessed March 24, 2020, at https://www.nytimes.com/2009/03/19/business/economy/19fed.html.
Goodman, Peter S., 2009. Jobs Report Highlights Shaky U.S. Recovery. The New York Times (October 2). Accessed March 24, 2020, at https://www.nytimes.com/2009/10/03/business/economy/03jobs.html.
Goodman, Peter S. and Jack Healy, 2009. 663,000 Jobs Lost in March; Total Tops 5 Million. The New York Times (April 3). Accessed March 24, 2020, at https://www.nytimes.com/2009/04/04/business/economy/04jobs.html.
Lazo, Alejandro, 2010. U.S. home foreclosures reach record high in second quarter. Los Angeles Times (July 15). Accessed March 24, 2020, at https://www.latimes.com/archives/la-xpm-2010-jul-15-la-fi-foreclosures-20100715-story.html.
Lobb, Annelena, 2009. Dow 5,000? There’s a Case for It. The Wall Street Journal (March 9). Accessed March 24, 2020, at https://www.wsj.com/articles/SB123654810850564723.
Luhby, Tami, 2010. Fannie to U.S.: We need another $15.3 billion. CNN Money (February 26,). Accessed March 24, 2020, at https://money.cnn.com/2010/02/26/news/companies/Fannie_mae_results.
Milmo, Dan, 2011. US economy and international stock markets start year with optimism. The Guardian (January 3). Accessed March 24, 2020, at https://www.theguardian.com/business/2011/jan/04/us-economy-buoys-international-markets.
Notes:
Please remember that all investments involve some risk. Be aware that fluctuations in the financial markets and other factors may cause declines in the value of your account. There is no guarantee that any particular asset allocation or mix of funds will meet your investment objectives or provide you with a given level of income.


